¶ Phase Diagram
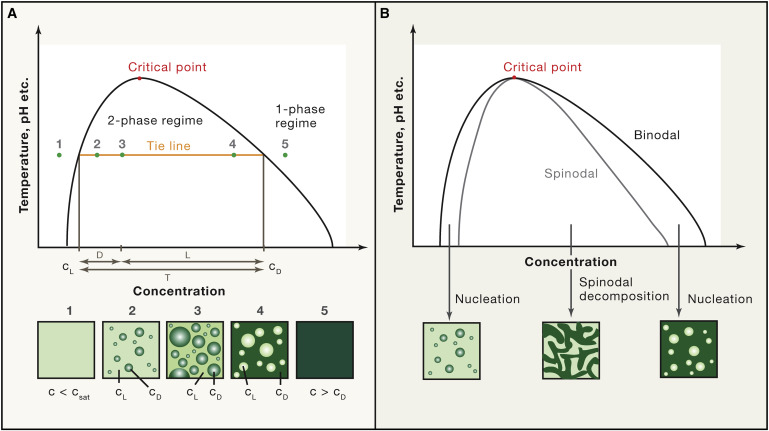
A phase diagram is used to depict the space in which monophasic and biphasic regimes involving a particular substrate exists as functions of the condition (substrate concentration, pH, temperature, salt concentration etc.). If multiple conditions are varied then multiple lines can be shown on the diagram to aid visualisation.
 [1]
[1]
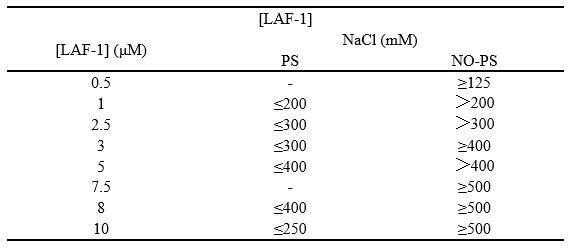
The information encoded in the phase diagram can also be represented in tabular form as shown below:
 [2]
[2]
Alberti et al. (2019), Considerations and Challenges in Studying Liquid-Liquid Phase Separation and Biomolecular Condensates ↩︎
Li et al. (2020), LLPSDB: a database of proteins undergoing liquid–liquid phase separation in vitro. Image sourced from LLPSDB: http://bio-comp.org.cn/llpsdb/images/PS00000001.jpg ↩︎